Iron Condor v Butterfly Spread
A High Probability Iron Condor v. a Low Probability Butterfly
In our last conversation we started to talk about the reality of option trading and the probability of various option spreads. Today, we’ll look further into this topic by comparing a high-prob Condor trade with a low-prob Butterfly.
Theoretical Probability
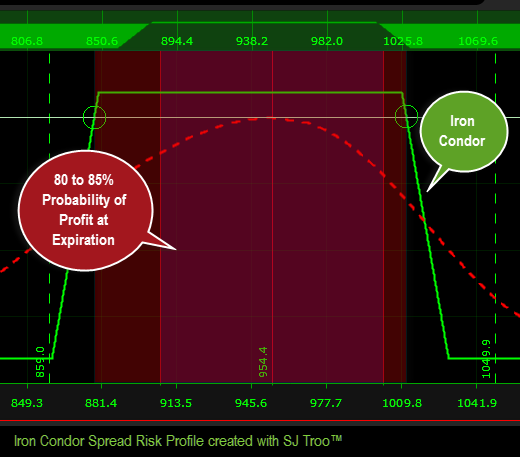
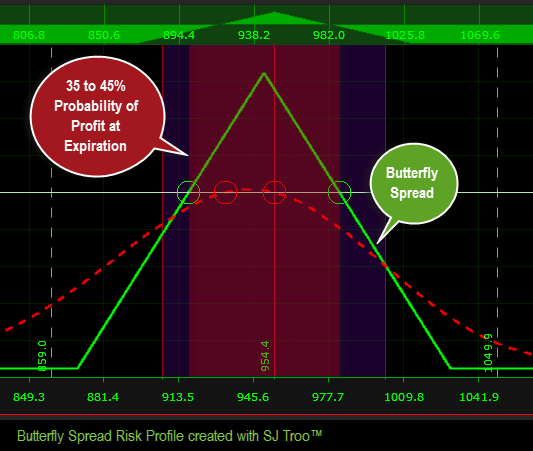
Traditional options platforms tend to display probability of an option spread based on standard deviations. When we look at the following trades, we’ll see that the Iron Condor has a probability at expiration of over 80% while the Butterfly is closer to 40%. One would think the 80% probability style of trade would produce more consistent returns over time. Let’s compare the realistic risk of each trade.
High Probability Iron Condor
Below you will find a typical set up of an Iron Condor constructed with about 30 days to expiry. The dark red area illustrates the profit zone at expiration date.

Next you will find a Butterfly Spread created at the same time. Notice that the probability at expiration is more narrow on this spread.

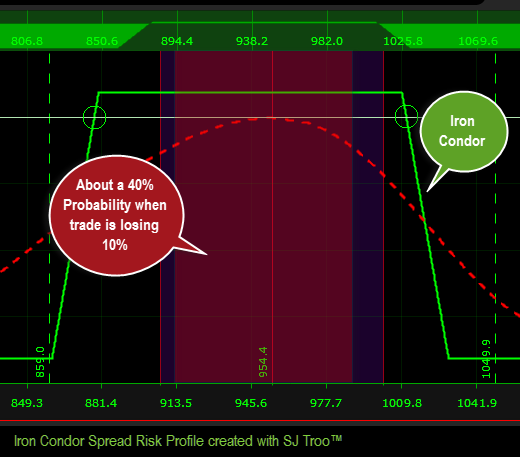
Here you see the “Realistic Probability” of the Condor is about 40% once you factor in a 10% loss. The red dashes indicate the loss area as the underlying asset moves around. The red zone gives the underlying wiggle room within a 10% loss to the upside or downside.

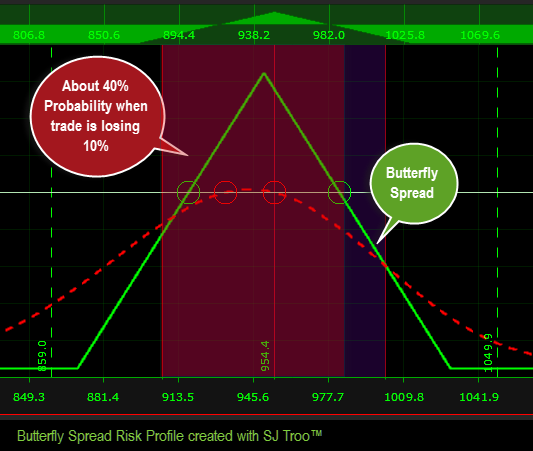
Here you see the “Realistic Probability” of the Butterfly is also about 40% once you factor in a 10% loss.

As you can see the High Probability Condor and the Low Probability Butterfly have a very similar short-term risk profile. The fact is we trade in “real time”, not in the future, which means the realistic probability (day to day risk) of these 2 trades is very similar. If you also take the time to look at Calendars, Diagonals and Credit Spreads, then you will see that they all fall into this type of realistic probability – somewhere around 40%.

