Backtesting Options Strategies For Portfolio Margin
In this article we backtest our trading method and short strangles to illustrate the importance of trade design, money management and long-term performance studies. These backtests are done using portfolio margin simulated accounts and are based on the TIMS margin method.
Multiple Short Strangle Backtests (Marketed by popular financial network tastytrade)
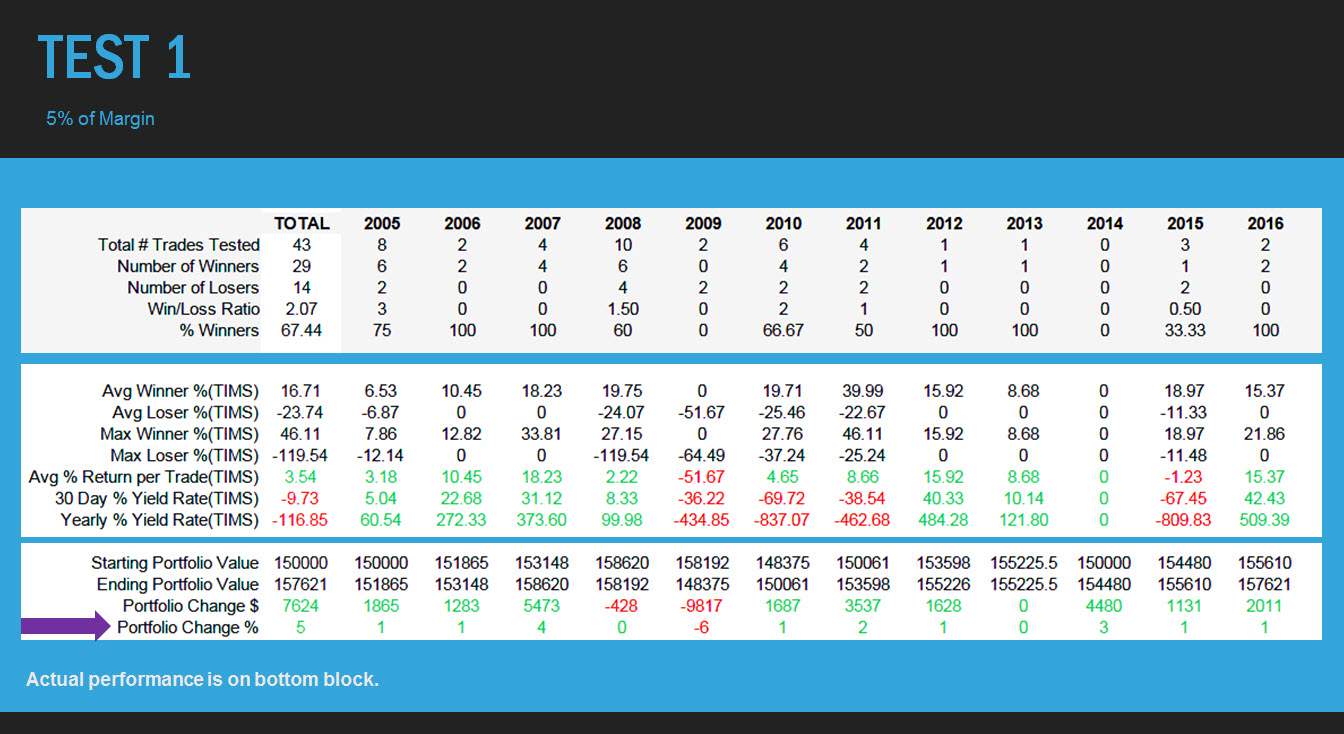
Trade Sizing: 5%
In this test we utilize 5% of the portfolio margin on average and follow exact rules that are published on a popular financial network.
Rules
We sell the 16 deltas, 45 DTE, enter trades at 50% IVR and higher, exit with 50% profit or 100% loss of initial credit.
Return on Investment
The system profits 5% over the 11 year backtest.
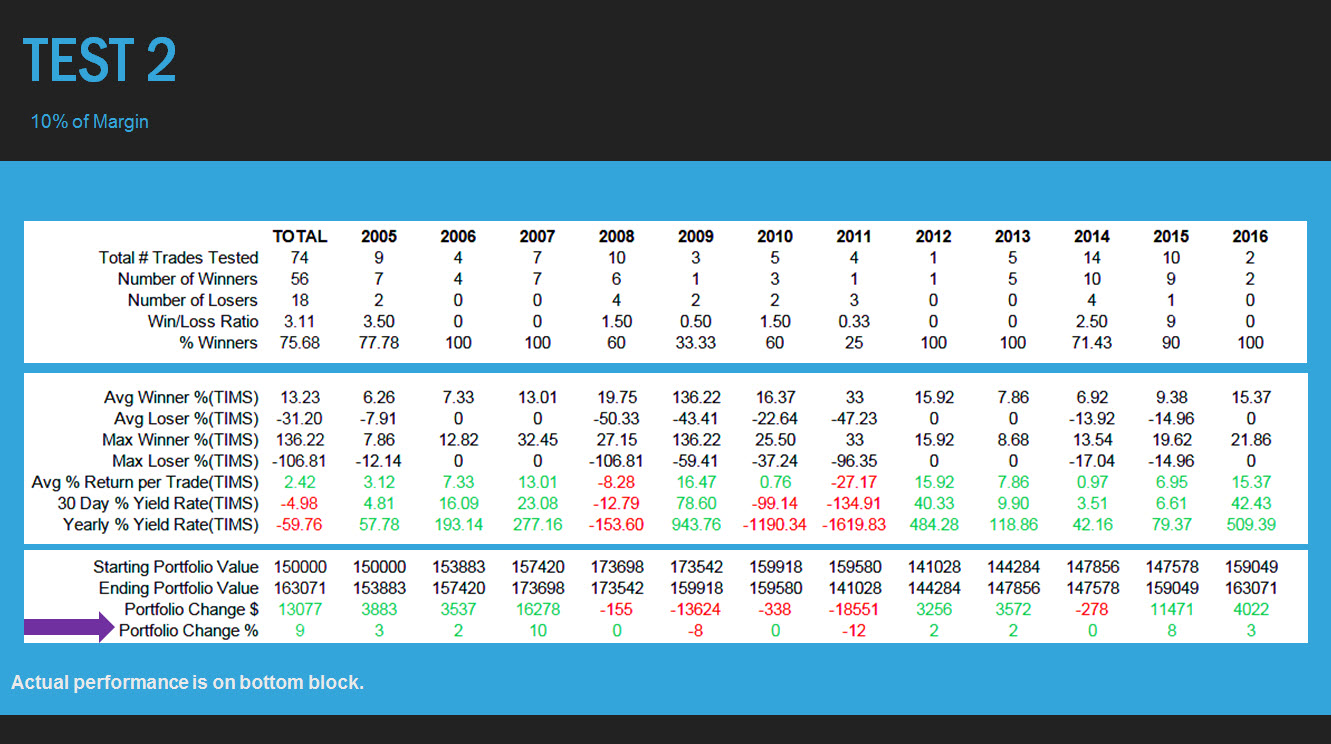
Trade Sizing: 10%
In this test we utilize 10% of the portfolio margin on average and follow exact rules that are published on a popular financial network.
Return on Investment
The system profits 9% over the 11 year backtest.
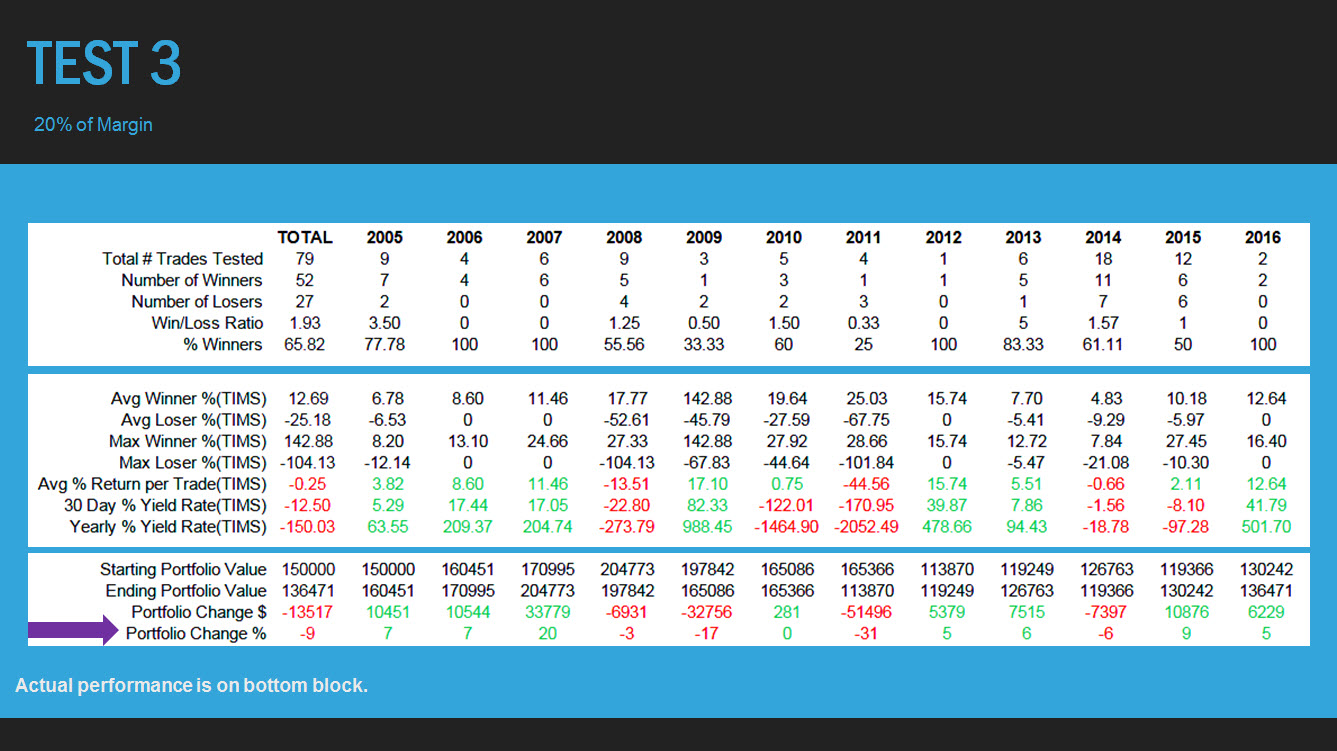
Trade Sizing: 20%
In this test we utilize 20% of the portfolio margin on average and follow exact rules that are published on a popular financial network.
Return on Investment
The system loses 9% over the 11 year backtest.
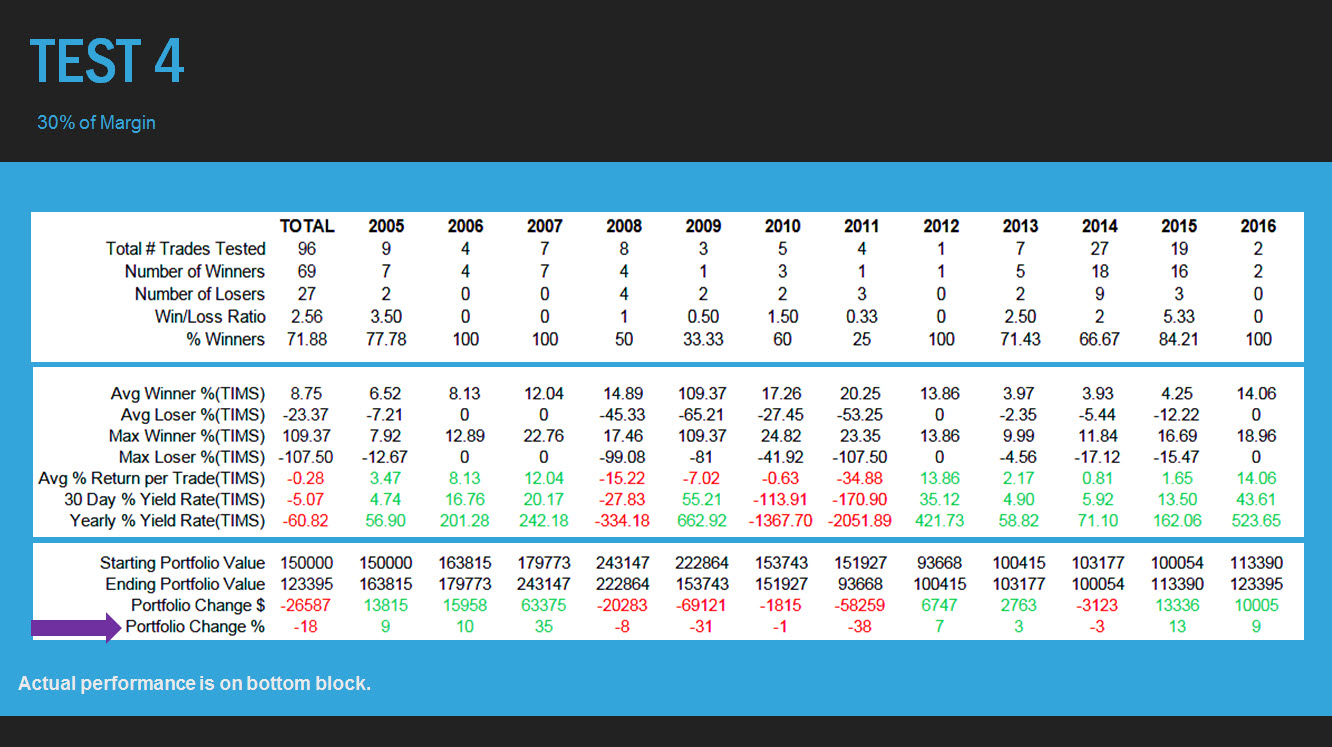
Trade Sizing: 30%
In this test we utilize 30% of the portfolio margin on average and follow exact rules that are published on a popular financial network.
Return on Investment
The system loses 18% over the 11 year backtest.
Summary of Short Strangle Backtests
We found that the short strangle trading system is a break-even trading method at best. After commissions and slippage are accounted for, this system did not make anything substantial over our long-term back test. Once we increased trading capital to 20% or more, the system began to lose money. The more we invested, the more it lost.
The win:loss ratio of the short strangle is poor and the average loses are much greater than the average winners; therefore, it does not make for a good trading system long-term. A trader can trade many years if they stay small, but the broker will be the only one to profit.
Next, we’ll look at the backtests of a method we teach at SJ Options.
“SJ Options Method” Backtested Performance
The SJ Options Method is founded on lowering risk and increasing probabilities. From design to adjustments and money management, the system has been perfected to the highest degree. When you join SJ Options Portfolio Margin Program, you receive a license to trade our method.
Behind every successful trader is a well-tested trading system. Below you’ll find some backtests of the SJ Options Method applied to a portfolio margin account.
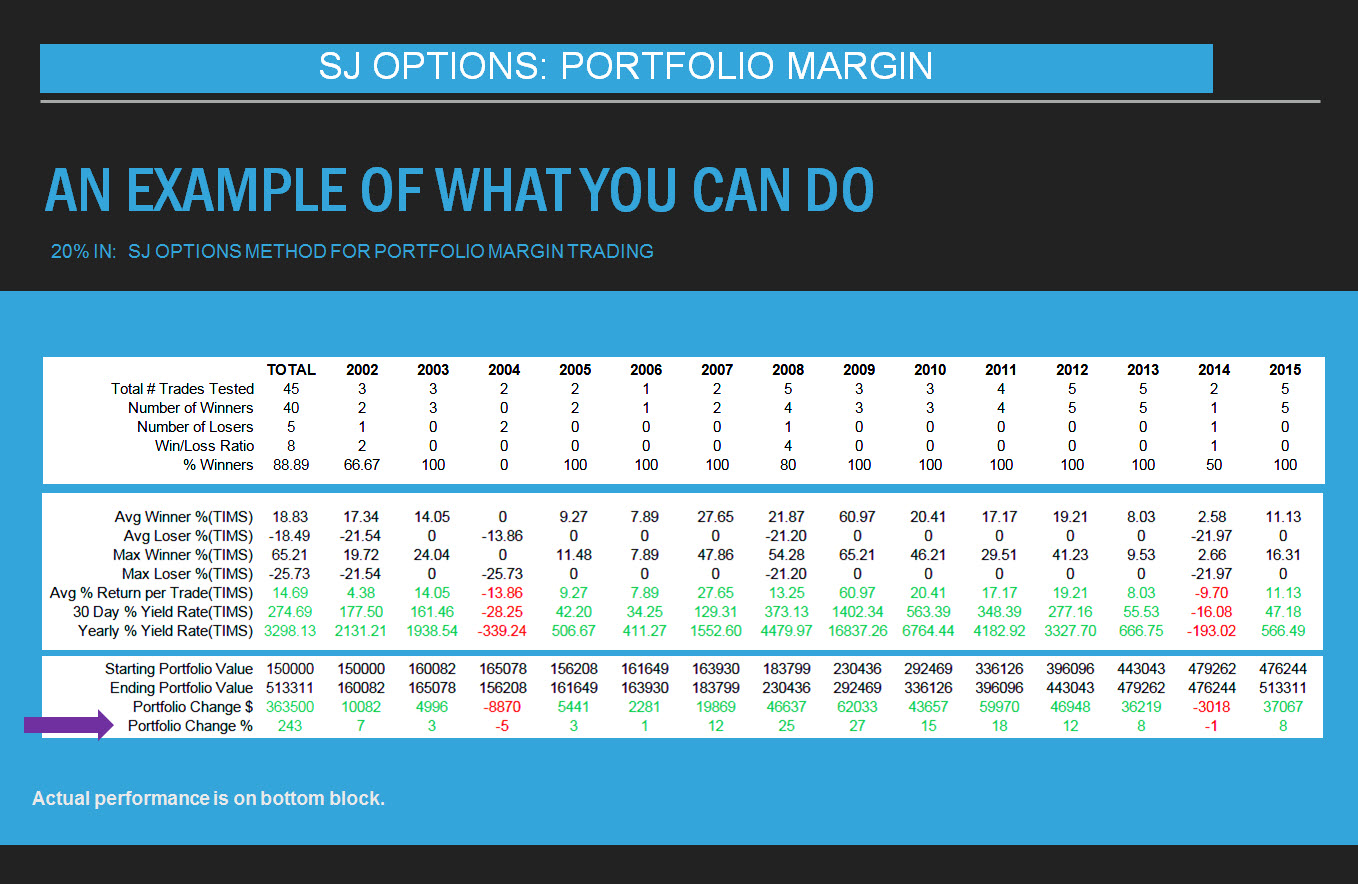
Trade Sizing: 20%
In this backtest we used 20% of the portfolio margin capital on average. The result was a 243% increase of the portfolio over from 2002 to the beginning of 2016. The backtest included commissions at .75 per contract.
Return on Investment
$150,000 increased to $513,311
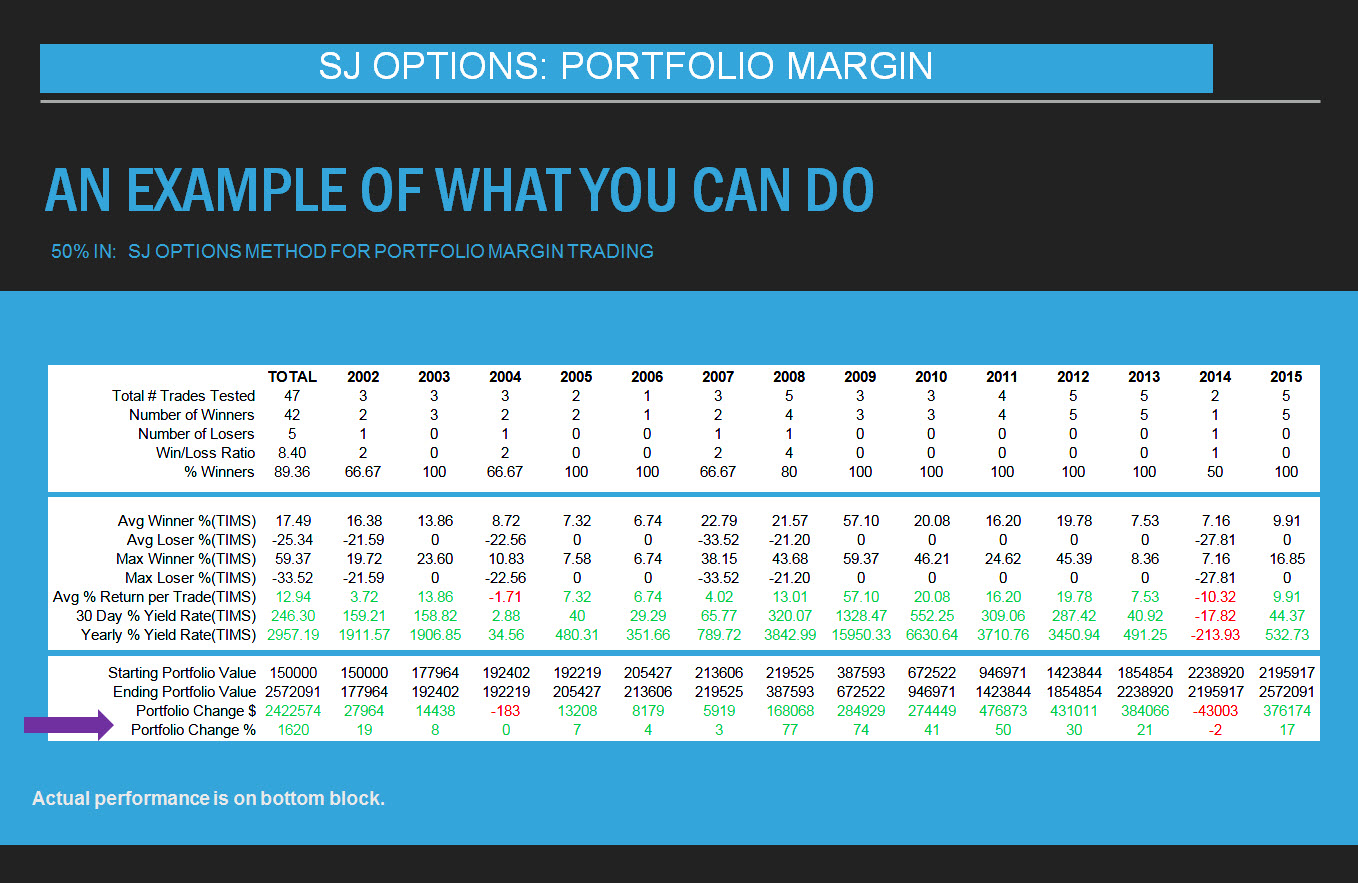
Trade Sizing: 50%
In this backtest we increased the invested amount to 50% on average. This resulted in an increase of the portfolio of 1620%.
Return on Investment
The initial $150,000 increased to over $2.5 Million.
Summary
The percentage winners of the SJ Options method was 89% on average. Average winners and losers are very similar. These numbers add up to a winning trading system. This is why our options trading system outperforms most others.
We highly encourage everyone to backtest their trading system for as many years as possible to see how it performed in the past.
Disclaimer
Backtested results do no guarantee future results. Read our Terms of Use for complete disclosures.

